Mastering PMP Certification Formulas for Your 2026 Exam
Mastering PMP Certification Formulas for the Current Exam
IT professionals preparing for the PMP exam often worry about the mathematical requirements. Understanding these calculations remains vital for certification success. Modern exams focus heavily on scenario-based questions, yet your ability to interpret project data and make correct decisions depends on these core formulas. Skipping this mathematical preparation puts your results at risk.
MindMesh Academy prioritizes practical knowledge over rote memorization. This guide provides the tools to master every essential PMP formula. You will learn to recall specific equations and use them to solve complex problems in both exam environments and professional project settings. Following this structured approach ensures you are well-prepared for any data-driven question you encounter while earning your PMP.
A Quick Reference Guide to Essential PMP Exam Formulas
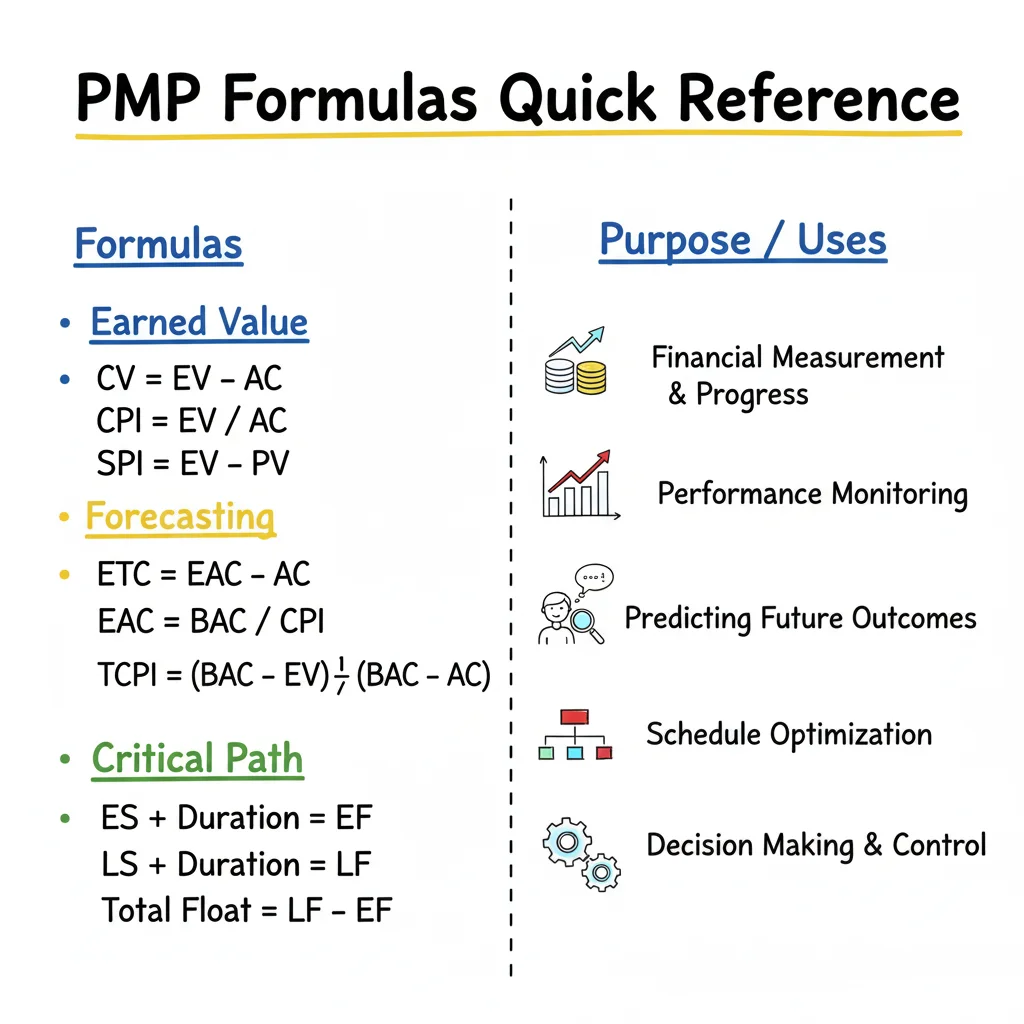 Caption: A quick reference sheet for PMP certification formulas, categorized for study.
Many PMP candidates fail because they treat these equations like simple vocabulary words rather than tools for analysis. The current exam is designed to verify that you understand when to apply a specific formula and why the resulting number matters to stakeholders. Success requires critical thinking. You will encounter wordy project scenarios where you must identify the correct formula, perform the calculation, and then use that result to make a professional project decision. This ability to interpret data is vital for passing the test and for your daily work as a project manager.
This guide serves as a resource for every PMP formula you need to know. We go beyond definitions to examine the operational context and practical examples. We also highlight common mistakes that frequently trip up even the most experienced project professionals during the high-pressure environment of the testing center.
Core PMP Formula Categories at a Glance
Organizing these formulas into specific categories helps make your study sessions more strategic and less overwhelming. By learning the primary purpose of each group and how much weight it carries on the current exam, you can prioritize your time. Focusing on high-value areas ensures you are ready for the questions that appear most frequently.
Use this overview to plan your study:
| Formula Category | Primary Purpose | Exam Importance |
|---|---|---|
| Earned Value Management (EVM) | To measure project performance against cost, schedule, and scope baselines and provide a look at integrated project health. | High |
| Forecasting (ETC, EAC) | To predict future results and estimate final costs or completion dates based on current trends and data. | High |
| Critical Path & Schedule | To find the shortest project duration, identify critical tasks, and calculate schedule flexibility or float. | Medium |
| Procurement & Risk | To calculate contract price points and quantify the financial impact of potential risks or project opportunities. | Medium |
| Communication & Estimation | To quantify team communication complexity and improve the accuracy of time or cost estimates. | Low |
This table is your study roadmap. In the following sections, we look closely at each category. We break down every formula with step-by-step examples to help you gain confidence in your calculation skills and practical application.
Understanding Earned Value Management (EVM) Formulas
For IT professionals preparing for the current exam, few topics are as vital as Earned Value Management (EVM) formulas. This mathematical framework provides an objective way to measure project performance. It replaces vague status reports with hard numbers by integrating project scope, schedule, and cost into a single tracking system. This tool allows you to manage various project types, such as large-scale software deployments, infrastructure hardware upgrades, or cloud migration initiatives, with high precision.
Learning EVM means moving away from estimations and toward data-driven decisions. At any point in the project lifecycle, these formulas provide answers to two primary questions:
- Are we on schedule to meet our agreed-upon deadlines?
- Are we following the established budget, or are we overspending?
To find these answers, you must master the three data points that form the base of every EVM calculation. These are Planned Value (PV), Earned Value (EV), and Actual Cost (AC).
The Three Pillars of EVM Data
You cannot calculate variances, performance indexes, or future forecasts without these three inputs. They represent what you intended to do, what you finished, and the cost of that progress.
- Planned Value (PV): This is the authorized budget assigned to the work scheduled to be completed by a specific date. It serves as your baseline. PV helps you determine the value of the work that should be finished according to your original timeline. In older project management texts, this is sometimes called the Budgeted Cost of Work Scheduled (BCWS). It is derived directly from the project schedule and the resource-loaded budget.
- Project Example: If you are building an AWS environment consisting of 10 modules over 10 weeks, and each module is budgeted at $1,000, your PV at the end of week 5 would be $5,000. This assumes you planned to finish exactly half the work by that time.
- Earned Value (EV): This is the value of the work actually completed to date, expressed in terms of the budget assigned to that work. It represents the "real" progress of the project. EV is also known as the Budgeted Cost of Work Performed (BCWP). It focuses on physical progress rather than just time elapsed or money spent. Measuring EV requires a clear definition of "done," such as completed code reviews, passed unit tests, or signed-off design documents.
- Project Example: In the same AWS project, if you reach the end of week 5 but have only finished and tested 4 modules, your EV is $4,000. Even though 5 weeks have passed, you have only "earned" the value of 4 modules based on your original budget.
- Actual Cost (AC): This is the total cost incurred for the work performed during a specific period. It is the money already spent from your project budget. AC is also referred to as the Actual Cost of Work Performed (ACWP). It includes all costs such as labor hours, software licensing fees, hardware procurement, and any overhead expenses related to the work measured in the EV.
- Project Example: This is the cumulative sum of all invoices and payroll entries for those 4 AWS modules. If your team had to pay for unexpected overtime to finish those modules, your AC might be $4,800.
Once you identify these three figures, you can analyze the health of any project without relying on subjective team updates.
Calculating Cost Variance and Schedule Variance
Variances act as your primary diagnostic tools. They show exactly how much your project has drifted from the plan in monetary terms. A positive variance indicates you are performing better than planned. A negative variance shows a performance gap that needs your attention.
The standard formulas for variance are:
- Cost Variance (CV) = EV - AC
- Schedule Variance (SV) = EV - PV
A helpful way to remember these is that both formulas start with EV. This consistency makes it easier to keep the equations straight during the pressure of the exam. Cost Variance measures financial efficiency by comparing what you earned (EV) against what you spent (AC). Schedule Variance measures time efficiency by comparing what you earned (EV) against what you planned to earn by this point in time (PV).
Interpreting Variance Results:
- CV > 0: You are spending less than budgeted for the work performed. This is a favorable result.
- CV < 0: You are spending more than budgeted for the work performed. This indicates you are over budget.
- SV > 0: You have completed more work than you planned to finish by this date. You are ahead of schedule.
- SV < 0: You have completed less work than you planned to finish by this date. You are behind schedule.
When these numbers are negative, you must investigate the cause. A negative CV might be caused by rising material costs or inefficient labor. A negative SV might indicate that a technical hurdle is blocking the team or that resources were diverted to other tasks.
Example: Calculating Variances in a Software Project
Applying these formulas to a real scenario helps clarify their utility. Imagine you are leading a mobile application development project. The project has a total Budget at Completion (BAC) of $100,000 and is scheduled to last 10 weeks. You are performing a status check at the end of week 5.
- Calculate PV: Your schedule says you should be 50% finished. PV = 0.50 * $100,000 = $50,000. This represents the value of the work the project plan expected you to finish by now.
- Determine EV: You look at the completed user stories and the quality assurance reports. You find that only 40% of the total project scope is fully completed and accepted. EV = 0.40 * $100,000 = $40,000.
- Find AC: You check the project accounts and see that the total expenditure so far is $48,000.
Using these inputs, you can find the variances:
- Cost Variance (CV) = $40,000 (EV) - $48,000 (AC) = -$8,000
- Schedule Variance (SV) = $40,000 (EV) - $50,000 (PV) = -$10,000
The math shows that your project is $8,000 over budget relative to the work finished. It also shows you are behind schedule by $10,000 worth of work. These figures provide a concrete baseline for discussions with stakeholders. Instead of saying "we are a bit behind," you can state exactly how far behind the project is in financial terms.
Reflection Prompt: As the project manager, what specific actions would you take with this data? Would you look for ways to reduce future costs, or would you request a schedule extension? These calculations provide the evidence needed to justify those decisions.
Analyzing Performance with CPI and SPI
Variances tell you the size of the gap, but they do not always convey the severity of the problem. For example, an $8,000 deficit on a $100,000 project is a 10% overrun on work performed, which is significant. However, that same $8,000 on a $10 million Azure migration project is less than 1% and might not require a major intervention. This is why performance indexes are used. They provide a ratio of efficiency that remains useful regardless of the project's scale.
The two primary indexes are:
- Cost Performance Index (CPI) = EV / AC
- Schedule Performance Index (SPI) = EV / PV
A result of 1.0 means you are performing exactly as planned. Any number greater than 1.0 is a sign of efficiency. Any number below 1.0 indicates a performance issue.
Interpreting Index Results:
- CPI > 1.0: You are earning more value than you are spending. The project is under budget.
- CPI < 1.0: You are spending more than the value of the work you produce. The project is over budget.
- SPI > 1.0: You are finishing work faster than planned. The project is ahead of schedule.
- SPI < 1.0: Your team is working slower than the schedule requires. The project is behind schedule.
These indexes allow you to forecast the future of the project. If your CPI is 0.80, you can predict that for every remaining dollar in the budget, you will only receive 80 cents of value unless something changes.
Example: Calculating Performance Indexes
We can use the same mobile application data to calculate these efficiency ratios:
- EV = $40,000
- AC = $48,000
- PV = $50,000
Now, we calculate the indexes:
- Cost Performance Index (CPI) = $40,000 / $48,000 = 0.83
- Schedule Performance Index (SPI) = $40,000 / $50,000 = 0.80
A CPI of 0.83 indicates that the project is losing 17 cents of value for every dollar spent. This is a clear indicator of cost inefficiency. The SPI of 0.80 shows that the team is only progressing at 80% of the planned rate. If this trend continues, the project will finish late and significantly over budget. These ratios provide the objective proof needed to initiate a recovery plan or re-baseline the project. To learn more about how these metrics work together, you can read our detailed guide on the fundamentals of EVM on MindMesh Academy.
Understanding these EVM metrics is a requirement for anyone taking the PMP exam. The exam is difficult, with historical first-time pass rates estimated between 60% and 70%. These statistics highlight that the Project Management Institute (PMI) wants to see if you can apply formulas to real-world scenarios, not just memorize them. Candidates who attend structured bootcamps often have higher success rates because they practice applying these formulas to complex word problems. Mastering these calculations is a reliable way to ensure you can pass with confidence. Be sure to memorize the definitions of PV, EV, and AC, as they are the starting point for almost every math-based question you will face.
Applying Forecasting Formulas Like ETC and EAC
*Caption: A video explanation of Estimate at Completion (EAC) calculations, a key PMP forecasting formula.*After using Earned Value Management (EVM) to determine your project's current status, the next step is to look forward. This is where forecasting formulas become useful. These predictive tools use your current performance data, such as cost and schedule indices, to answer the most frequent stakeholder question: "What will be the final result regarding money and time?"
These calculations help you move from tracking history to predicting the future. Knowing you have spent more than planned is a start, but you must also predict the final cost and the resources required to finish the remaining tasks. For the PMP exam, you must understand these formulas well. You will see many questions that ask you to calculate the most likely financial outcome based on a project's current state.
Reliable forecasting keeps project sponsors informed. If a project is trending toward a significant budget overrun, identifying that trend early allows for corrective actions like scope reduction or budget increases. Without these formulas, you are simply guessing. By using current performance metrics, you provide a data-driven outlook that carries more weight during project status meetings and steering committee reviews.
Estimate to Complete (ETC): The Work Remaining
The Estimate to Complete (ETC) represents the amount of money needed to finish the project from this point forward. It does not include the money already spent. Instead, it focuses entirely on the future. This metric helps you understand the funding requirements for the next several months of the project.
The basic calculation for ETC is:
- Formula: Estimate to Complete (ETC) = EAC - AC
The logic behind this is simple. You take the new projected total cost at the end of the project and subtract the actual cost you have already incurred. The remaining amount is what you need to request or allocate to reach the finish line. Because this calculation depends on having an accurate total cost projection, you usually calculate the final total first. Understanding how much "work is left" in terms of dollars is a requirement for managing cash flow and resource allocation effectively through the end of the project life cycle.
Estimate at Completion (EAC): The Four Scenarios
The Estimate at Completion (EAC) is a prediction of the total cost of the project when all work is finished. While the original budget was your plan at the start, the EAC is a reality-based metric that changes as the project progresses. It accounts for how efficiently the team has worked so far and what you expect for the future.
The current exam tests your ability to choose the right EAC formula based on the specific situation described in a word problem. You need to recognize four main scenarios.
1. EAC When Original Estimates Were Flawed (but current variance is atypical) This formula applies when you realize your initial budget figures were wrong, but the specific problems you faced so far were one-time events. For example, if a piece of specialized equipment broke down and cost $5,000 to repair, that is a unique event. You don't expect it to happen every month. You assume the rest of the work will follow the original plan.
- Formula: EAC = AC + (BAC - EV)
- When to Use: Choose this when you encounter a non-recurring issue that will not impact future work. You take the money already spent and add it to the remaining work, which is calculated at the original budgeted rate.
- PMP Exam Clue: Look for phrases like "the variance to date is atypical" or "we expect future performance to follow the original planned rate."
2. EAC When Current Performance Will Continue (most common) This is the most frequently tested forecasting formula. It assumes that if you have been 10% over budget for the first half of the project, you will likely stay 10% over budget for the second half. This formula scales the entire budget based on your proven efficiency.
- Formula: EAC = BAC / CPI
- When to Use: Use this as your default when the current cost variances are typical and expected to persist. If your Cost Performance Index (CPI) is 0.8, you are only getting 80 cents of value for every dollar spent. Dividing the total budget by 0.8 gives you a realistic total cost that reflects this continuing inefficiency.
- PMP Exam Clue: Watch for phrases such as "assume current variances will continue," "the CPI is expected to remain the same," or "future performance will match past performance."
3. EAC When Both Cost and Schedule Performance Matter This calculation is used when the project is behind schedule and over budget, and the deadline is firm. When you are late, you often have to spend more money on overtime or faster shipping to catch up. This formula combines the impact of both indices to create a more conservative (usually higher) cost estimate.
- Formula: EAC = AC + [(BAC - EV) / (CPI × SPI)]
- When to Use: This applies when you are behind schedule (SPI < 1.0) and over budget (CPI < 1.0) and the schedule performance must be considered. By multiplying CPI and SPI in the denominator, the formula accounts for the fact that being late often drives costs even higher as the team tries to meet the original completion date.
- PMP Exam Clue: Look for scenarios where the project must meet a deadline despite being behind, or phrases like "performance considering both cost and schedule factors."
4. EAC When You Have a New Estimate (from the ground up) Sometimes, the original plan is no longer useful. A major change in scope or a massive external event might make the old budget irrelevant. In these cases, you stop using the old figures and perform a new, bottom-up estimate for every remaining task.
- Formula: EAC = AC + New ETC
- When to Use: This is used after a major event forces the team to create a fresh estimate for all remaining work. The total project cost becomes the sum of the actual money spent so far plus this brand-new estimate for the remaining tasks. It is the most accurate method but requires the most effort to calculate.
- PMP Exam Clue: Look for "new bottom-up estimate for remaining work" or "the original project plan is no longer valid due to major changes."
PMP Exam Strategy Tip: The specific wording in the question tells you which formula to use. If the question says the project team expects things to keep going as they have been, use EAC = BAC / CPI. If the question says the initial budget was based on poor assumptions but the team has now fixed those issues, use EAC = AC + (BAC - EV). Discerning these small differences is the key to selecting the right answer quickly.
The following flowchart helps you evaluate your project status using Earned Value variables. This logic helps you decide which forecasting approach is necessary for your situation.
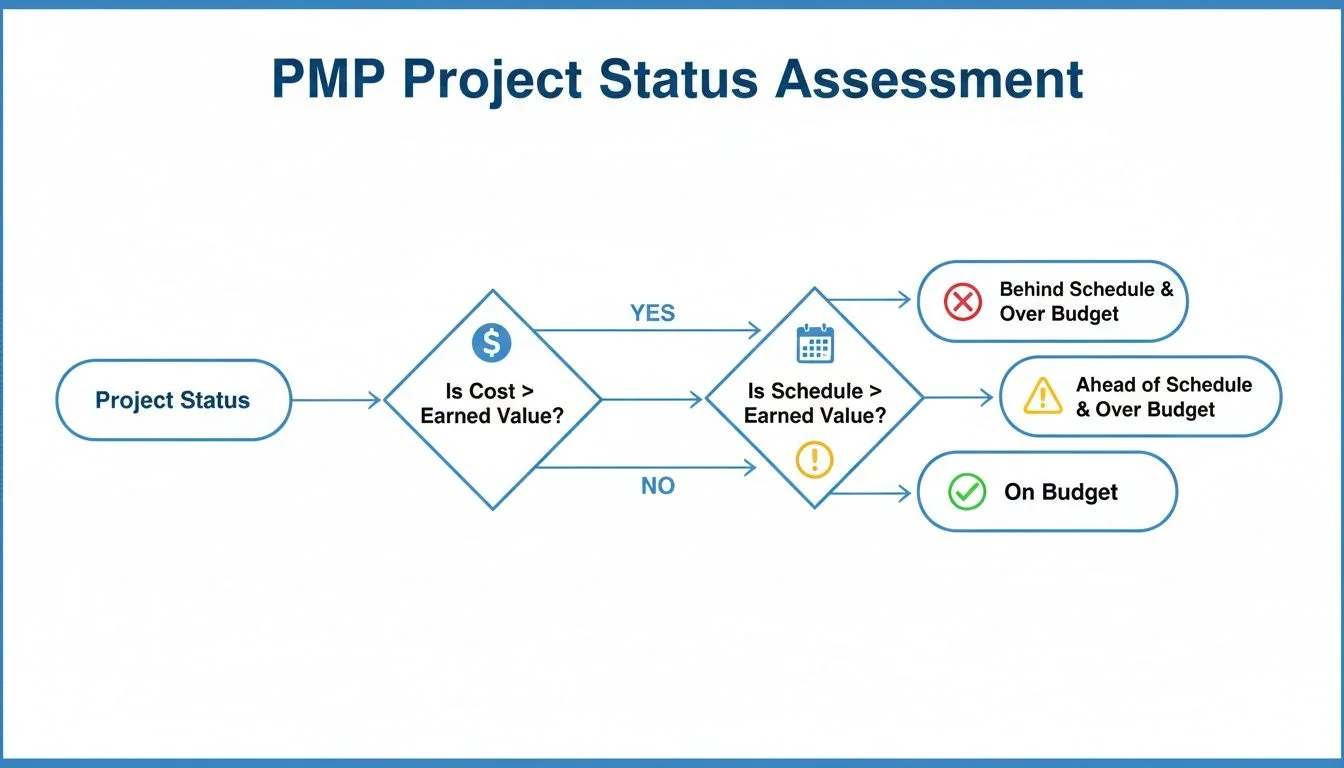 Caption: A flowchart illustrating how to assess project health using Earned Value (EV), Actual Cost (AC), and Planned Value (PV).
When your actual costs are higher than your earned value, the project is over budget. When the value you have earned is less than what you planned to earn by this date, you are behind schedule. Accurate forecasting using the formulas above allows you to communicate these risks to stakeholders before they become project failures. By providing an EAC, you show that you understand the current trends and have a data-backed expectation for how the project will conclude. This level of analysis is what the exam expects from a qualified project manager.
Mastering Critical Path and Schedule Formulas
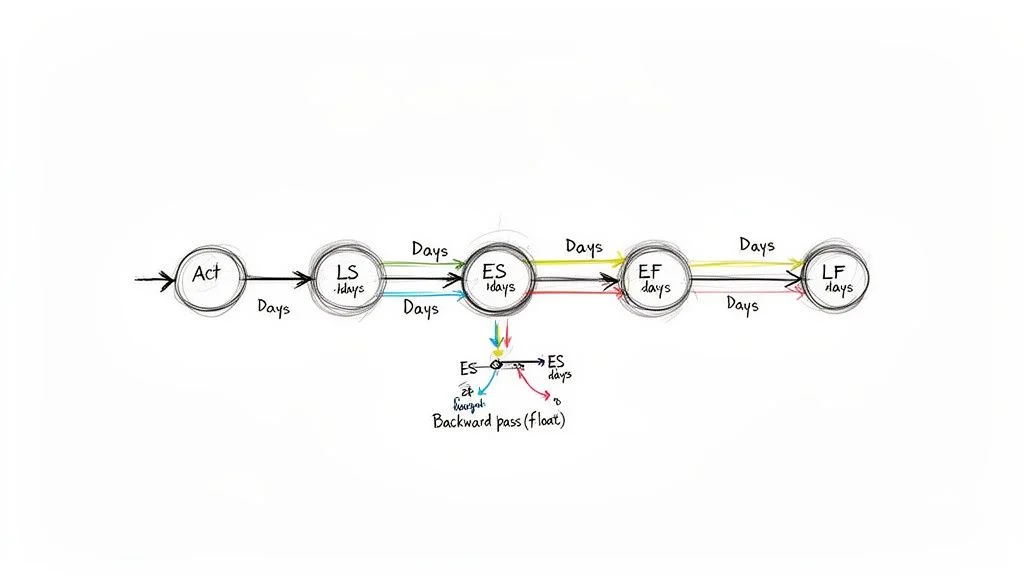 Caption: A visual representation of a project schedule network, detailing the calculation of Early Start, Early Finish, Late Start, and Late Finish for tasks.
Budget management is a core part of the PMP syllabus, but a project that misses its deadline can be more damaging to a company than one that slightly exceeds its budget. For IT project managers handling complex software development cycles, infrastructure deployments, or system integrations, a firm grasp of schedule network analysis is essential. The current PMP certification formulas for scheduling provide the mathematical basis for determining the shortest possible project duration. These calculations allow you to identify which specific tasks have zero room for delay and which have a bit of flexibility.
The Critical Path Method (CPM) is the primary technique used to manage these timelines. The critical path is the longest continuous sequence of activities in a project. This path is the sequence that determines the earliest date the project can end. If any task on this path is delayed by even a few hours, the final completion date for the entire project slips by that same amount. This delay affects client service level agreements, team availability, and financial penalties. Understanding this path allows you to prioritize resources effectively; you know exactly which tasks require your most experienced developers or the most stable hardware.
Calculating ES, EF, LS, and LF
Pinpointing the critical path requires calculating four specific dates for every task within the schedule network diagram. You find these values by performing two distinct mathematical sweeps through the project: a forward pass and a backward pass.
The Forward Pass (Determining the Earliest Dates) Start at the beginning of the project and move forward through the logic of the network. This pass calculates the absolute earliest a task can start and finish based on its dependencies.
- Early Start (ES): This is the soonest an activity can begin. For the first activity in your project, the ES is typically Day 1. For all subsequent activities, the ES is determined by the Early Finish of its immediate predecessor. If a task has two predecessors, you must use the Early Finish of the one that ends latest.
- Early Finish (EF): This is the soonest an activity can be completed.
- Formula: EF = ES + Duration
The Backward Pass (Determining the Latest Dates) Once you reach the final date with the forward pass, you reverse the process. You move from the project end date back toward the start to see how much flexibility exists for each task. You are looking for the latest possible moments a task can start or end without pushing back the final project deadline.
- Late Finish (LF): This is the latest an activity can finish without delaying the project. For the final project activity, the LF is usually equal to its EF. For preceding tasks, the LF is the Late Start of the activity that immediately follows it. If a task is a predecessor to multiple activities, its LF is the lowest Late Start value among those following tasks.
- Late Start (LS): This is the latest an activity can begin without causing a delay.
- Formula: LS = LF - Duration
Uncovering Schedule Flexibility with Float
With ES, EF, LS, and LF values calculated for every task, you can now determine the Total Float, which many project managers call Slack. Float is a metric that shows the amount of time an activity can be delayed from its Early Start without changing the project completion date. This is your buffer.
There are two ways to calculate Total Float, and both formulas will result in the same number:
- Total Float = LS - ES
- Total Float = LF - EF
Any task with a Total Float greater than zero has scheduling flexibility. This breathing room allows you to shift resources if a developer falls ill or a hardware shipment is delayed. However, if a task has zero Total Float, it has no flexibility. These tasks are the building blocks of your critical path. Identifying these tasks early helps you focus your monitoring efforts where they matter most.
Key Takeaway for PMP Certification & Real-World Projects: The critical path is the sequence of activities where the Total Float equals zero. These tasks require constant attention from the project manager. Any disruption in these specific activities translates directly into a delay for the final delivery. Learning to calculate float accurately is a fundamental skill for managing IT environments where dependencies are tight and deadlines are strict. By mastering these formulas, you can defend your project timeline with data and allocate your best resources to the tasks that carry the most risk to the schedule. This technical proficiency ensures you are well-prepared for the exam and capable of leading projects to a timely finish.
Formulas for Procurement, Communication, and Risk
Earned Value Management (EVM) and schedule analysis calculations usually dominate PMP exam study guides. However, you should not overlook the formulas used in Procurement, Communication, and Risk Management. These calculations appear less frequently than cost variance or schedule performance index questions, but they offer straightforward points if you understand the underlying logic. You should expect to see at least one question from each of these categories on the current exam. Mastering these equations demonstrates that you can manage the financial and social complexities of a project beyond basic budgeting.
Calculating the Point of Total Assumption (PTA)
The Point of Total Assumption often confuses candidates because it involves multiple variables and specific contract types. This calculation applies only to Fixed Price Incentive Fee (FPIF) contracts. In these agreements, the buyer and seller share the risk of cost overruns up to a certain point. The PTA is the specific dollar amount in actual costs where the seller assumes all financial risk for further overruns. Once the project hits this threshold, the buyer’s payment is capped at the ceiling price. Any additional costs spent to complete the work are paid for by the seller, directly reducing their profit.
The formula helps project managers identify when a seller might start cutting corners or deprioritizing a project because their profit margin is disappearing.
- Formula: PTA = [(Ceiling Price - Target Price) / Buyer's Share Ratio] + Target Cost
- Target Cost: The expected cost of the project agreed upon during negotiations.
- Target Fee: The profit the seller expects to earn if they meet the target cost.
- Target Price: The sum of the target cost and the target fee.
- Ceiling Price: The maximum amount the buyer is contractually obligated to pay.
- Buyer's Share Ratio: The percentage of cost overruns the buyer pays before the ceiling is reached. For an 80/20 split, the buyer's share is 0.80.
A Practical PTA Example for a Software Contract
Consider a project where you are hiring a vendor to build a custom data module. You negotiate an FPIF contract with these specific figures:
- Target Cost: $200,000
- Target Fee: $20,000
- Target Price: $200,000 (Target Cost) + $20,000 (Target Fee) = $220,000
- Ceiling Price: $240,000
- Share Ratio: 80/20 (The buyer pays 80% of overruns, and the seller pays 20% until the ceiling is reached).
To find the point where the seller takes over all risk, apply the formula:
- PTA = [($240,000 - $220,000) / 0.80] + $200,000
- PTA = [$20,000 / 0.80] + $200,000
- PTA = $25,000 + $200,000
- PTA = $225,000
This calculation shows that at an actual cost of $225,000, the buyer’s total obligation reaches the $240,000 ceiling. If the project costs climb to $226,000, the seller pays that extra $1,000 out of their own pocket. Their fee, which started at $20,000, would drop to $14,000. If costs continue to rise, the seller could eventually lose money on the deal. Understanding this helps you monitor vendor performance more closely as costs approach the $225,000 mark.
The Communication Channels Formula
Communication is often the most time-consuming part of project management. As the number of stakeholders increases, the number of potential pathways for information grows much faster than the team size. The communication channels formula reveals the complexity of keeping everyone informed. It shows why adding more people to a late project can actually slow it down—a concept known as Brooks’s Law. Each new person adds a new set of relationships that must be maintained.
The formula identifies every possible path between any two people in a group.
- Formula: N(N-1) / 2
- N: The total number of people involved, including the project manager, team members, and stakeholders.
When using this formula, pay close attention to the wording of exam questions. If a question says "you have a team of 10 people and you add 2 more," N becomes 13 (you + 10 + 2). Forgetting to include the project manager in the count is a frequent error that leads to the wrong answer.
Real-World Application: A small project team with 5 members has 10 channels to manage (5 * 4 / 2). If you add 5 more stakeholders to the project, your team size doubles to 10, but the communication complexity more than quadruples. You now have 45 channels (10 * 9 / 2). Managing 45 different lines of communication requires formal tools, status reports, and structured meetings to prevent information from getting lost. Without a clear plan, the "noise" in these channels will likely cause project delays.
Calculating Expected Monetary Value (EMV)
In risk management, you need a way to prioritize different threats and opportunities. Expected Monetary Value (EMV) provides a mathematical basis for this prioritization by assigning a dollar value to uncertainty. It is a key part of Quantitative Risk Analysis. By looking at risks through a financial lens, you can decide which ones require an expensive mitigation plan and which ones you can simply monitor.
You find the EMV by looking at two factors: how likely the risk is to happen and what it will cost if it does.
- Formula: EMV = Probability x Impact
- Probability: The chance of the event occurring, expressed as a percentage or decimal.
- Impact: The cost or gain associated with the event. Threats are expressed as negative numbers, while opportunities are expressed as positive numbers.
Managers use the sum of all EMVs to calculate the contingency reserve. This is the budget set aside to handle "known-unknowns." If you have ten risks and the total EMV is -$50,000, that figure serves as a data-backed justification for your reserve fund.
EMV in Action: Analyzing a Project Risk
Suppose you are leading a cloud migration project. Your risk register identifies a potential issue with data latency that might require purchasing additional server capacity.
- The probability of this latency issue is 30% (0.30).
- The impact is an estimated $50,000 for hardware and setup fees.
Calculate the EMV as follows:
- EMV = 0.30 x -$50,000 = -$15,000
Now, imagine you also have an opportunity. There is a 20% (0.20) chance that a new automation tool will save the team $20,000 in labor costs.
- EMV = 0.20 x $20,000 = $4,000
To find the total risk position for these two items, you combine them: -$15,000 + $4,000 = -$11,000. While the negative EMV is not the exact amount you will spend—you will either spend $0 or $50,000—it provides a statistical average. This allows you to compare the latency risk against a different risk that has a 10% probability but a $200,000 impact (EMV of -$20,000). Even though the second risk is less likely, its EMV is higher, meaning it should generally be a higher priority for your risk response planning.
The PMP certification remains a leading credential for professionals, with over 1.5 million individuals holding the title globally (verify current stats on the PMI website). The high concentration of these professionals in tech hubs—such as China with 36.62% of the total and the United States with 26.53%—shows that these standardized methods are the language of international business. By learning to apply these formulas, you prepare yourself to work at this international standard. For more data on how these skills impact the project management field, you can visit Plaky.com.
Your PMP Formula Cheat Sheet and Study Plan
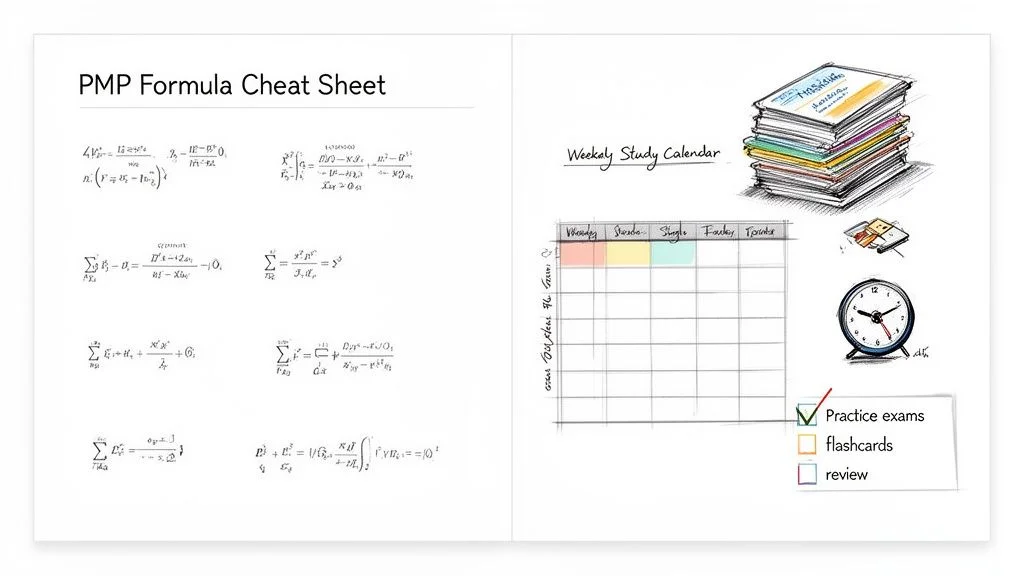 Caption: A visual guide to creating your PMP formula cheat sheet and integrating it into a structured study calendar.
Understanding the logic behind PMP certification formulas is only half the battle. The real test comes when you must recall and apply these equations under the pressure of a timed exam environment. To bridge the gap between knowing a formula and using it correctly, MindMesh Academy offers a downloadable PMP Formula Cheat Sheet. This two-page PDF summarizes the essential equations found in this guide. Use it during your final review sessions and for practicing your "brain-dump" strategy before the current exam begins. To master these formulas, you need a disciplined study schedule that focuses on application.
Building Your Formula Study Plan for PMP Success
Effective study methods rely on active learning rather than simple rote memorization. Creating your own flashcards is a reliable way to internalize the logic behind the numbers. For every formula, write the equation on one side. On the reverse, record the specific situation where the formula applies, what each variable represents, and what the final value indicates about project performance. Explore efficient techniques for how to take notes on a computer to keep your notes organized and accessible. Keeping your technical notes structured allows for quicker review during final review.
Key to Sustained Success: From extensive experience coaching PMP candidates, consistent, focused practice invariably outperforms sporadic cramming. Dedicate 20-30 minutes each day specifically to working through formula-based practice questions. This daily reinforcement builds the mental muscle memory and rapid recall you will rely upon when the clock is ticking on exam day. Short sessions help keep information fresh without causing burnout.
Your objective is to make these calculations second nature. You can only achieve this level of mastery through high-quality, realistic practice problems that mirror the actual test format. Our PMP Certification Study Guide provides a structured path by integrating formula drills directly into your personalized schedule. By treating the math as a daily tool rather than a weekly hurdle, you reduce exam-day anxiety and increase your confidence. Practicing with real-world scenarios helps you understand the reason behind the math, which is often how the current exam presents these challenges.
Investing the time into mastering these formulas provides a strong return. Earning your PMP certification can increase your salary by an average of 16% to 23%—representing a significant boost to your lifetime earnings. Certified professionals remain in high demand across the IT sector. Proficiency in these formulas proves to employers that you can manage project budgets and schedules with quantitative precision. You can find more project management salary statistics on ravetree.com to help plan your career progression.
Frequently Asked Questions About PMP Formulas
IT professionals preparing for the PMP exam often worry about the mathematical components. This concern is common, but you can build confidence by understanding the scope of the math required. Mathematical formulas are a standard part of the Project Management Professional certification, but they do not have to be a barrier to your success. Let’s address the most frequent questions to ensure you are ready for the current exam.
A top concern for many is the volume of math questions. While PMI does not list a specific number in the official Exam Content Outline, feedback from people who have recently taken the test suggests that 10-15% of the exam involves formulas. In a test with 180 questions, you should expect between 18 and 27 questions that require you to calculate a value or interpret numerical data to decide on a project management action. (Verify current exam patterns on the PMI website).
Do I Really Need to Memorize Every Single PMP Formula?
The short answer is no. You should prioritize understanding when and why to apply a formula rather than relying on rote memorization. You must know the core Earned Value Management (EVM) equations, critical path methods, and forecasting formulas like Estimate at Completion (EAC) and Estimate to Complete (ETC). Memorizing them is the first step, but application is what counts.
The PMP exam is context-driven. Questions rarely ask you to perform a simple calculation without background data. Instead, they present a scenario and require you to choose the right tool from your kit. For example, knowing the basic EAC formula is not enough. You must determine which of the four versions of the EAC calculation fits the project situation described. One version assumes current variances will continue, while another assumes future work will happen at the planned rate. Your ability to distinguish between these project scenarios is the real skill being tested.
What’s the Most Effective Way to Practice the PMP Math?
The best way to prepare is to work through many high-quality practice questions. This helps you build the skills needed to pass with confidence. Regular practice with these formulas ensures that you do not spend too much time on a single question during the actual test. This approach provides two major benefits:
- Builds Calculation Speed: Solving problems repeatedly makes the math feel more natural. You will work faster and make fewer errors when the pressure is on.
- Improves Scenario Recognition: You will learn to spot keywords and data points that signal which formula is needed. Practice helps you see the difference between a project that is behind schedule and one that is over budget.
When you use simulators, look for those that offer step-by-step explanations for each answer. Arriving at the correct number is only half the battle. You must understand the logic behind the calculation. If you want more ways to improve your study routine, look at our guide on proven study tips to pass the PMP exam at MindMesh Academy.
Final Takeaway: The PMP exam is not a math test. It assesses your professional judgment as a project manager. Formulas are tools that provide data about a project's health. Focus on how to interpret these results to make better project decisions. If you adopt this mindset, you will be prepared to lead projects using data rather than just guessing.
Ready to turn your knowledge of formulas into a certification? MindMesh Academy provides adaptive study paths and practice questions to help you master every PMP knowledge area. Look through our PMP exam prep resources at PMP Practice Exams to move closer to your goal today.

Written by
Alvin Varughese
Founder, MindMesh Academy
Alvin Varughese is the founder of MindMesh Academy and an enterprise architecture leader. An electrical engineer by training, he moved from factory automation in South Africa to cloud architecture at GE Appliances and Humana (Fortune 50), and holds 20 professional certifications including AWS Solutions Architect Professional, Azure DevOps Engineer Expert, and Microsoft Agentic AI Business Solutions Architect. He built MindMesh Academy after interviewing too many highly certified candidates who couldn't answer basic questions: the goal is prep that makes you better at the job, not just able to pass the exam.