How to Measure Training Effectiveness: A Practical Guide
You finished your training program. Now, how do you prove it actually worked? Measuring training effectiveness goes beyond simple compliance or attendance logs. It requires linking educational goals to concrete business outcomes. To show value, you must track changes in employee knowledge, behavior, and business results both before and after the training. This data-driven approach demonstrates exactly how your training influences the bottom line.
Why Measuring Training Effectiveness Is Non-Negotiable

Stop viewing training as a luxury or a simple line-item expense. When you quantify its impact, Learning & Development (L&D) shifts from a cost center to a critical engine for business growth. Proving the outcome of a program involves more than defending a budget; it demonstrates how educational initiatives create a more capable and resilient team.
Without consistent measurement, training occurs in a vacuum. You might feel that a specific session went well, but personal feelings do not secure next year's budget. Hard data and clear outcomes are what leadership requires.
The Business Case for Measurement
L&D professionals often struggle with one specific hurdle: securing executive buy-in. Industry data indicates that 49% of professionals find it difficult to get managers to prioritize learning. You cannot overcome this resistance without concrete proof that your methods produce results. High-quality measurement provides the evidence needed to convince leadership by focusing on the outcomes they value most:
- Higher Employee Retention: Workers stay at organizations where they see a path for growth. If a company invests in professional development, the staff remains loyal. Reports show that 94% of employees would stay with an employer longer if the company prioritized their learning. Proper measurement allows you to link your training programs directly to these retention statistics.
- Improved Engagement and Productivity: Productive teams are almost always engaged teams. Effective training acts as a primary catalyst for this engagement. Measurement helps you tie specific educational initiatives to key performance indicators (KPIs) and overall output.
- Secured Budgets and Strategic Influence: Approaching a budget meeting with a documented return on investment (ROI) transforms the discussion. You are no longer merely requesting funds; you are demonstrating their necessity for company success. Using a data-driven strategy ensures L&D maintains a strategic role in corporate planning.
Ultimately, evaluating training is about accountability and improvement. It identifies what succeeded, what failed, and where to allocate resources in the future.
This commitment to evaluation builds a high-impact culture that values continuous improvement across all departments. To stay informed, consider reviewing the best practices for online learning that currently define modern corporate education and skill acquisition.
Choosing the Right Evaluation Model
Before you begin measuring, you must select a framework. A clear evaluation model provides the structure needed to explain the impact of your training. Without it, you are simply collecting disconnected data points that fail to tell a convincing story to leadership.
Measuring effectiveness without a defined model is like building a house without a blueprint. You might produce something that stands, but it will lack the structural integrity to support long-term goals. A model provides the necessary constraints and directions to connect early employee reactions to final business outcomes. It ensures your data collection is intentional rather than accidental.
The Foundational Kirkpatrick Model
One of the most trusted frameworks in the field of learning and development is the Kirkpatrick Four-Level Training Evaluation Model. Developed in the 1950s by Donald Kirkpatrick, it remains a standard because it offers a clear, four-step path to assess training. It moves from initial impressions to bottom-line results.
Why has this model remained popular for decades? The answer is simple: it works. Organizations that apply this model report an average of 20-25% improvement in employee performance and a 10-15% increase in productivity (verify these benchmarks against your internal historical data). It creates a level of discipline that helps teams avoid wasting resources on training that does not deliver.
To understand how this works, consider a real-world scenario: rolling out new project management software to a technical team.
-
Level 1: Reaction. This stage measures how participants responded to the training. Was the instructor engaging? Did the material feel relevant to their daily work? Most teams capture this through post-training surveys, often called "smile sheets." For a software rollout, you should ask direct questions like: "How satisfied were you with the software training session?" Use a 1-5 scale to make the sentiment easier to track.
-
Level 2: Learning. This level determines if the participants actually acquired the intended knowledge or skills. It marks the transition from perception to competency. You can measure this through quizzes, written exams, or practical skills demonstrations. In our software example, you might require the team to complete a task-based test where they must locate and use specific features in a sandbox environment to prove they can use the tool.
-
Level 3: Behavior. This is the point where theoretical knowledge turns into practical action on the job. Are employees actually using the software in their daily workflows? Measuring this requires patience, as it usually occurs weeks or months after the initial session. You can track this through direct manager observations, peer feedback, or performance reviews. Three months after the software training, a manager would check if the team is consistently logging tasks in the new tool instead of using outdated spreadsheets.
-
Level 4: Results. This final level connects training outcomes to the company's core objectives. You track key performance indicators (KPIs) like revenue growth, error reduction, or speed. For our software rollout, a successful result might be a 15% reduction in project completion times over a six-month period (confirm this metric matches your specific project baseline).
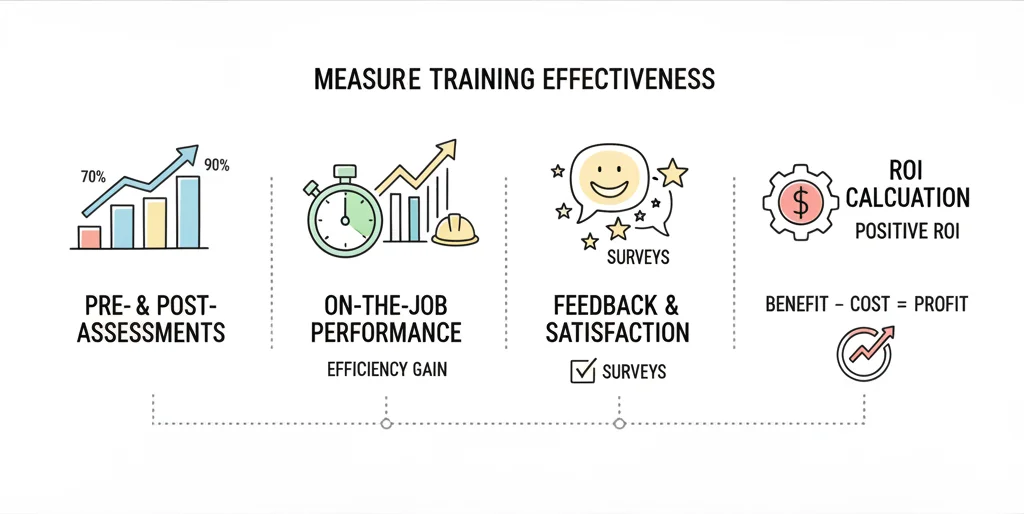
This visual helps clarify how to pick the right metrics for each level.
Everything starts with setting clear objectives. Those objectives then dictate the specific metrics and performance targets you will track throughout the process.
Adding a Financial Lens with Phillips ROI
The Kirkpatrick model is a powerful tool, but it does not assign a specific dollar value to the results. Jack Phillips expanded on this framework by adding a fifth level to address the financial concerns of stakeholders.
Level 5: Return on Investment (ROI). This level compares the monetary benefits of the training program directly to its costs. It answers the question that every executive eventually asks: "Was this investment worth the money we spent?"
Calculating ROI provides the hard financial data required to justify your budget. It helps you make a logical case for future programs by translating the Level 4 results into the financial language that leaders use to make decisions.
Here is how you would calculate the ROI for the software training example:
- Isolate the effects of the training: You must determine what portion of that 15% reduction in project completion time came specifically from the training. This involves accounting for other factors like seasonal workload changes or updates to hardware.
- Convert those benefits to a monetary value: Calculate the cash value of the time saved. If the improved efficiency freed up 500 employee hours, multiply those hours by the average fully-loaded hourly rate, which includes wages plus benefits (confirm current salary and benefit overhead with HR).
- Calculate total program costs: Tally every expense. This includes instructor fees, materials, the hourly wages of employees while they were in the classroom, and any software subscription fees associated with the training period.
- Calculate the ROI: Use the standard calculation: (Net Program Benefits / Program Costs) x 100. If your net benefits reached $50,000 and your total costs were $20,000, your ROI is 150% (verify current internal accounting methods for calculating overhead).
Using a proven model like Kirkpatrick, and extending it with the Phillips ROI method, gives you a professional roadmap. It moves your evaluation beyond simple satisfaction surveys toward a strategic analysis of true business impact.
Pinpointing Your Key Training Metrics

Once your evaluation framework is established, you must move from high-level theory to practical action. This phase involves selecting the specific metrics that indicate whether your training achieved its intended purpose. You are looking for indicators that provide clear evidence of success or failure.
Generic metrics often lead to vague reports that fail to impress stakeholders. Your objective is to identify Key Performance Indicators (KPIs) that create a visible link between the training environment and tangible business improvements. Without this connection, the data you collect is little more than noise that obscures the actual value of your work.
A frequent error in training evaluation is the failure to establish a baseline. You must determine what "normal" looks like before any instruction begins. If you do not have a pre-training benchmark, proving that your program caused a specific impact becomes an impossible task. You cannot measure growth if you do not know the starting point.
Matching Metrics To Your Mission
The metrics you track have to reflect your specific goals. You would not use the same criteria to evaluate a leadership retreat as you would for a technical workshop on Python or AWS. The measurement tool must fit the task at hand.
To organize your thoughts, categorize your metrics based on the type of information they provide. These categories align with the levels of the Kirkpatrick Model, helping you build a layered view of effectiveness.
- Learning Metrics: These determine if the participants actually acquired the intended knowledge. These metrics assess the immediate grasp of new skills and information through tests or demonstrations conducted right after the training session ends.
- Behavioral Metrics: This category serves as the link between knowing a skill and applying it. You are looking for evidence that employees changed their daily work habits because of the training. This is often the most difficult stage to measure but provides the most insight into long-term success.
- Business Impact Metrics: These metrics connect the training program to the organization's bottom line. You are looking for hard data like increased revenue, faster production times, higher customer satisfaction scores, or reduced operational costs.
To see how this works in a practical setting, consider the rollout of a new CRM system for a sales department.
An Example In Action: Sales CRM Training
When a sales team learns a new CRM, measuring "attendance" tells you nothing about their ability to use the software to close deals. Your metrics should describe a path of progress from basic understanding to improved sales performance.
A structured evaluation for this program would include specific targets:
Learning Metrics (What they learned)
- Assessment Scores: The goal is for participants to achieve 90% or higher on a post-training proficiency quiz. This test should cover core features like lead entry, pipeline stages, and reporting.
- Confidence Ratings: Use a pre- and post-session survey to track self-reported confidence. The target is to see the average score move from a 4/10 to an 8/10 on a standard Likert scale.
Behavioral Metrics (What they now do)
- CRM Adoption Rate: The organization sets a target for 95% of the sales team to log calls and update deal statuses in the system every day. This metric is measured over the first 30 days after the training concludes.
- Data Entry Accuracy: During weekly pipeline reviews, sales managers will audit entries to verify a 50% reduction in data entry errors. This ensures the data in the system remains reliable for forecasting.
Business Impact Metrics (The bottom line)
- Sales Cycle Length: By using the CRM to automate follow-ups and track leads, the team expects a 10% decrease in the average sales cycle during the next quarter. Faster movement through the funnel increases overall capacity.
- Lead Conversion Rate: Improved tracking should result in a 5% bump in the lead-to-customer conversion rate. This provides a direct financial justification for the time spent in training.
This data allows you to tell a clear story. You can show that the training improved specific skills, which led to better software adoption, which ultimately shortened the sales cycle. This narrative is far more persuasive to an executive than a simple list of who attended the class.
A Look At How Training Goals And Metrics Align
Use the following table to visualize how different organizational goals require different KPIs across the three metric categories. This structure helps ensure you are not missing any level of the evaluation process.
Matching Training Goals to Key Metrics
| Training Goal | Learning Metric (Level 2) | Behavioral Metric (Level 3) | Business Metric (Level 4/5) |
|---|---|---|---|
| Improve Sales Skills | 90%+ score on product knowledge quiz. | 25% increase in cross-selling attempts logged in CRM. | 10% increase in average deal size per quarter. |
| Boost Leadership Capability | Successful completion of case studies on conflict resolution. | 20% improvement in 360-degree feedback on communication scores. | 15% increase in team retention rates over the next year. |
| Increase Software Adoption | 85% of users pass a feature-based skills assessment. | 95% of target users log in and complete a key task daily. | 20% reduction in time to complete key business processes. |
| Enhance Customer Service | 95% pass rate on a simulated customer interaction test. | 30% reduction in call escalation rates. | 10-point increase in Net Promoter Score (NPS). |
This table acts as a mental framework. It requires you to look past the classroom and consider how the training affects the company balance sheet. When you fill out this grid for your own programs, you identify the specific data points you need to collect from managers and system logs.
It's All About Adaptability
Effective measurement requires flexibility. You have to adapt your KPIs to the specific purpose of the training. A program teaching soft skills like empathy or active listening requires a different approach than a technical workshop on cloud security or database management.
For a leadership development program, your measurement strategy might look like this:
- Learning: Participants must successfully analyze three different case studies involving team conflict and propose solutions that follow company policy.
- Behavior: You track 360-degree feedback scores from the participants' direct reports. You look for a 20% improvement in scores related to "transparency" and "support" six months after the program.
- Business Impact: You monitor the turnover rates of the departments led by these managers. A 15% increase in employee retention suggests that the leadership training is helping keep valuable talent at the company.
The underlying principles of measurement remain consistent, even as the specific KPIs change. By choosing metrics that cover learning, daily behavior, and final business results, you create a thorough case for the value of your training initiatives. This approach moves you beyond just providing instruction and allows you to prove that your work creates a measurable advantage for the organization.
Gathering and Analyzing Your Data

You have defined your metrics and set your goals. Now the actual work of proof begins. You need to collect evidence that shows your training programs are moving the needle. This is where your strategy shifts from theoretical planning to practical application. You are gathering the raw information that allows you to tell a clear story about the impact of your program.
The most effective approach involves a balanced mix of data points. You need immediate feedback to understand the learner experience and a long-term view to judge performance. This combination provides a complete picture of your results. It moves beyond simple satisfaction scores and looks at actual behavioral changes and organizational results.
Choosing Your Data Collection Tools
A variety of tools are available for data collection. These range from traditional methods that provide reliable results to modern, technology-driven solutions. Using a combination of these methods is the most effective way to address all four levels of the Kirkpatrick Model.
Here are the most effective ways to acquire the data you need:
-
Post-Training Surveys: The standard "smile sheet" is a primary tool for Level 1 (Reaction). These surveys provide instant feedback regarding the instructor's performance, the relevance of the content, and the quality of the learning environment. Keep these surveys short. If you ask too many questions, completion rates will drop. Focus on specific questions about how applicable the content felt to the employee’s daily tasks.
-
Knowledge Assessments: To track Level 2 (Learning), you must verify what information participants actually retained. This can involve multiple-choice quizzes, hands-on skill demonstrations, or digital simulations. Implementing a pre-training assessment followed by a post-training assessment is an excellent way to show growth. It creates a clear "before and after" snapshot that proves knowledge gain occurred during the session.
-
On-the-Job Observation: This method is necessary to confirm Level 3 (Behavior). Managers or designated peers watch employees while they work to see if they apply new skills. Using a standardized checklist helps ensure these observations remain consistent across different departments. It removes subjective bias and provides a concrete record of skill application in the workplace.
-
360-Degree Feedback: For a holistic view of progress, 360-degree feedback gathers input from an employee’s manager, their peers, and their direct reports. This method is especially useful for measuring the success of soft skills training, such as leadership development or conflict resolution. Seeing how multiple people perceive a change in behavior provides a more accurate assessment than a single manager's report.
Your objective is not just to collect high volumes of data. You need to collect the right data from various perspectives. A high quiz score is a good sign, but it becomes much more meaningful when paired with a manager's observation of that specific skill being used to solve a customer problem or close a contract.
Tapping Into Your Existing Technology
You likely already have access to a significant amount of data within the systems your company uses every day. By linking these platforms, you can automate much of your data collection process. This provides objective proof of training effectiveness without requiring manual entry for every data point.
The Learning Management System (LMS) is the logical starting point for your search. It provides insights that go far beyond simple completion records. You should examine engagement metrics, such as the total time spent on specific modules and how often learners interacted with supplemental materials. Identifying exactly where learners tend to drop off or struggle can help you improve the content. If you are currently evaluating your options for a platform, our guide on comparing Learning Management Systems for 2025 provides a detailed breakdown of the top tools currently available.
Do not limit your search to the LMS. Other systems offer critical data:
- HR Software (HRIS): This system tracks high-level business impacts. You can connect training participation records to annual performance review scores, promotion schedules, and employee retention rates. This data shows whether your programs are successfully helping employees grow their careers and stay with the company longer.
- CRM or Sales Platforms: For sales-specific training, your CRM is a vital source of truth. You can track metrics like call volume, average deal size, and the sales cycle length for the specific group that received training. When you compare these numbers to a control group that did not receive the training, the direct impact of the program becomes clear.
- Project Management Tools: If you have trained a team on a new agile methodology or a specific software tool, check your project management platform. You can monitor changes in project completion times, task efficiency, and error rates.
Modern software has changed how we view these metrics. Instead of relying on a single snapshot in time, many platforms now offer continuous feedback loops. Organizations that use these continuous data models see a 30% increase in learner engagement and a 25% jump in skill retention. AI-driven analytics can also help by identifying trends across thousands of data points. Some organizations report a 40% reduction in time spent on data processing by using these automated tools.
Analyzing the Data
Once you have gathered your data, you must transform those numbers into a clear narrative. You do not need a background in advanced statistics to do this effectively. The most straightforward method is to organize your findings according to the Kirkpatrick levels. This creates a logical flow for your report.
- Level 1 (Reaction): Summarize the results from your surveys. Report the average satisfaction score across the group. It is also helpful to pull out three or four recurring themes from the open-ended comments to provide context for the numbers.
- Level 2 (Learning): Calculate the average score improvement between the pre-training and post-training assessments. Highlighting a 25% increase in test scores is a clear way to demonstrate that the information was successfully communicated and absorbed.
- Level 3 (Behavior): Identify trends from your workplace observations. For instance, you might report that "after the workshop, 85% of managers were observed using the new coaching framework during their weekly check-ins with staff."
- Level 4 (Results): Compare your key performance indicators (KPIs) from before the training to the results after the training. A simple bar chart showing a 15% drop in customer support tickets following a technical training session is a very effective way to show value to stakeholders.
Your primary task is to connect these different points. You want to show how positive reactions led to increased knowledge, how that knowledge changed how people work, and how those changes produced the business results your leadership team expects to see.
Calculating and Communicating Training ROI
Data collection is only the first phase of the evaluation process. You have likely observed how training leads to new behaviors and how those behaviors influence your business goals. Now you must close the loop by showing the financial return on that effort. This brings us to the Return on Investment (ROI). This specific metric is often what stakeholders and executives care about most when they review budget requests or departmental performance.
Do not let the math or the terminology worry you. Calculating ROI is a task for every department, not only finance. It is a practical tool you can use to prove that your training programs are strategic investments rather than simple line-item expenses. When you present a clear ROI, you demonstrate that learning delivers measurable value to the organization.
From Business Impact to Financial Value
The primary challenge is moving from abstract business improvements to concrete financial figures. You take the positive results you gathered during the evaluation of Level 4 results and assign a dollar value to them. This step requires you to look at the operational costs associated with the problems your training solved.
Consider a training program for customer support teams that results in a 15% drop in call escalation rates. To calculate the value, identify the average cost of an escalated call. This involves looking at the hourly rates of the senior managers or technical specialists who handle those difficult cases. If a standard agent costs the company $25 per hour to handle a call, but an escalated call requires 30 minutes of a manager’s time at $60 per hour, every avoided escalation saves significant money. By multiplying that savings by the total number of prevented escalations, you turn a soft skill improvement into a hard financial figure.
Common ways to assign value to these improvements include:
- Productivity Jumps: Measure the increase in output or the reduction in time spent on specific tasks. If a project team completes their work 10% faster after a technical workshop, that time saved translates directly into salary savings or capacity for new projects.
- Fewer Errors: Quantify the cost of a single mistake. This might include wasted raw materials, time spent on rework, or credits issued to unhappy customers. Multiply the cost of one error by the total reduction in errors following the training.
- Better Sales: This is often the easiest metric to track. Connect your training directly to changes in average deal size, improvements in lead-to-close conversion rates, or increases in total monthly revenue.
You must be conservative and credible in these estimates. Use the data your company already tracks and be ready to explain every assumption. It is better to present a modest figure that stands up to scrutiny than to present an inflated number that fails when questioned.
The ROI Calculation Demystified
Once you have determined the monetary value of the benefits, the calculation is basic arithmetic. The standard ROI formula provides a percentage that shows exactly how much profit the company made for every dollar spent on the training.
ROI (%) = [(Net Program Benefits – Total Program Costs) / Total Program Costs] x 100
To make this calculation accurate, you must track your costs precisely. Do not skip the hidden expenses that occur during the planning and execution phases.
- Development Costs: This includes the total time spent by instructional designers and subject matter experts to create the content.
- Delivery Costs: Factor in instructor fees, facility rentals, travel expenses, and any per-user technology licenses.
- Participant Costs: This is a frequently ignored cost. Calculate the total salary and benefits for every employee for the hours they spent in the training session instead of their regular duties.
- Material Costs: Include the price of workbooks, software, hardware, or any other supplies required for the course.
Let’s look at a concrete example. Suppose your total program costs, including staff time and materials, were $25,000. After evaluating the results, you found that the monetized benefits from improved productivity and error reduction totaled $90,000.
The net benefit is $65,000 (calculated as $90,000 minus $25,000). Using the formula: ($65,000 / $25,000) x 100 = 260% ROI.
Presenting Your Findings for Maximum Impact
Generating a strong ROI figure is a major milestone, but you also have to communicate that number effectively. Your objective is to secure future support and funding. To do this, focus on storytelling rather than just reciting data from a spreadsheet.
Create a visual dashboard that summarizes the findings for your stakeholders. Start with the headline—your ROI percentage—and then explain the steps that led to that result. Show the progression from the employees' initial reactions to the actual changes in their behavior on the job and the final business outcomes.
This level of accountability is becoming the benchmark for successful organizations. Research shows that companies dedicated to calculating training ROI see an average return of 353%. This means every dollar invested generates $3.53 in business value. Current data suggests that 60% of Fortune 1000 companies use ROI evaluation to some degree. You can review more details on how organizations measure their ROI on Instride.com.
When you present your findings to leadership, lead with the business problem you were asked to solve. Show how the training specifically addressed that problem and what the financial result was. This turns a standard report into a success story that justifies continued investment in your training initiatives.
From Measurement to Mastery: Improving Your Training Programs
Gathering data is not the finish line. It is the start of the next phase. The real value lies in building a feedback loop that transforms isolated training sessions into a self-correcting learning engine. Your analysis reveals what works and highlights exactly where you missed the mark.
Digging for the root cause is the next step in your evaluation strategy. If staff understand the material but never apply it on the job, the issue likely stems from a lack of support after the session ends. Perhaps managers are not providing the necessary coaching needed to reinforce new skills, or employees lack quick-reference guides at their desks. Effective measurement exposes these gaps so you can fix them.
From Diagnosis to Action
After identifying the cause of a performance gap, you can take specific action. Treat your data as a roadmap for your next set of improvements. If feedback indicates that the material was useful but the presentation style was uninspiring, you have a clear target for your energy.
Consider these common scenarios and the steps you can take to resolve them:
- Learners are bored. When engagement scores drop, reconsider your delivery format. Swap long, static slide decks for hands-on workshops, interactive simulations, or short videos that get straight to the point.
- Skills aren't sticking. If knowledge does not change behavior, look beyond the classroom. Focus on how managers support their teams, provide practical checklists for daily use at the workstation, or set up peer groups to reinforce new habits through social learning.
- The content missed the point. If the session failed to solve a specific business problem, the initial analysis was likely flawed. Revisit your needs assessment process to ensure future programs align with actual organizational requirements and departmental goals.
Do not treat evaluation like a final report card. It is a diagnostic tool. Data exists to improve future performance rather than simply critiquing past efforts. Use these insights to make tomorrow's training smarter and more effective.
Building a Culture of Iteration
The ultimate goal is to move away from one-time evaluations toward a continuous, repeating process. Every program you launch, track, and analyze builds institutional knowledge. This makes the entire learning and development department more efficient over time. This cycle keeps your curriculum relevant to current industry standards and ensures it provides tangible value year after year.
To prepare for your next cycle, use a training needs assessment template. This ensures your programs start with a strong base from day one. Integrating this cycle of measurement, detailed analysis, and refinement into your company culture ensures that training does not just happen; it improves over time.
Answering Your Key Questions
How Soon Should I Measure Training Effectiveness?
Determining the right time to evaluate your program depends entirely on which metric you are tracking. You cannot rely on a single survey to provide a full picture. Instead, collect data at specific intervals to see how the material translates from the classroom to the office.
For Level 1 (Reaction), gather feedback immediately. Distribute post-session surveys while the experience remains clear in the minds of your participants. Their initial impressions are valuable for judging the instructor and the environment.
Assessing Level 2 (Learning) requires two steps. Test knowledge right after the session ends, then follow up a few weeks later. This second check confirms whether the information stuck or if it has already faded. You want to ensure the knowledge moved into long-term memory.
Measuring Level 3 (Behavior) and Level 4 (Results) requires more time. You should typically wait 3 to 6 months (verify this timeline against your specific organizational goals) after the training ends. This window allows employees to apply new skills to their daily tasks and gives the business enough time to see those changes reflected in KPIs or revenue figures. Real change rarely happens overnight.
What If I Can’t Isolate The Training's Impact?
Proving that training alone caused a specific outcome is a frequent hurdle. External factors like market shifts or new software often muddy the results. You are not the only one struggling with this difficulty.
The most reliable method is using a control group. Identify a similar team that did not receive the training and use their output as a baseline. Comparing the two groups offers the clearest evidence of the program's value. It helps eliminate the "noise" of other variables.
If a control group is not feasible, look at performance trends. Examine data from the months leading up to the program and compare it to the months that follow. You can also gather subjective data by asking. Have participants and their managers estimate the percentage of their performance improvement that resulted from the training. Managers often see daily changes that data might miss. While this is subjective, it provides context.
Training Effectiveness vs. Efficiency: What's the Difference?
People frequently use these terms as synonyms, but they represent different goals.
Effectiveness: This focuses on the impact of the program. Did the training achieve its objectives? Did employee performance actually improve?
Efficiency: This looks at the resources used to reach those objectives. Was the training delivered within the allotted time and budget? Was the cost per head minimized?
A program can be highly efficient—such as an inexpensive e-learning module sent to thousands of staff—yet fail because no one learned the material. Aim for a balance where you achieve measurable results without wasting organizational resources.
Ready to master the skills you need for your next certification? MindMesh Academy provides expert-curated study materials and evidence-based learning techniques to help you pass your exams and excel in your career. Start your training today!

Written by
Alvin Varughese
Founder, MindMesh Academy
Alvin Varughese is the founder of MindMesh Academy and holds 18 professional certifications including AWS Solutions Architect Professional, Azure DevOps Engineer Expert, and ITIL 4. He's held senior engineering and architecture roles at Humana (Fortune 50) and GE Appliances. He built MindMesh Academy to share the study methods and first-principles approach that helped him pass each exam.