Pass your certification exam — and actually remember what you learned.
You've put in the work. You deserve a study system that makes it count, not one more brain dump that fades by exam day.
Start with free study guides, practice exams, and flashcards for every certification. Every answer counts. Enroll to unlock the full question bank and a learning journey tailored to your weaknesses.
We've Sat for These Exams Too
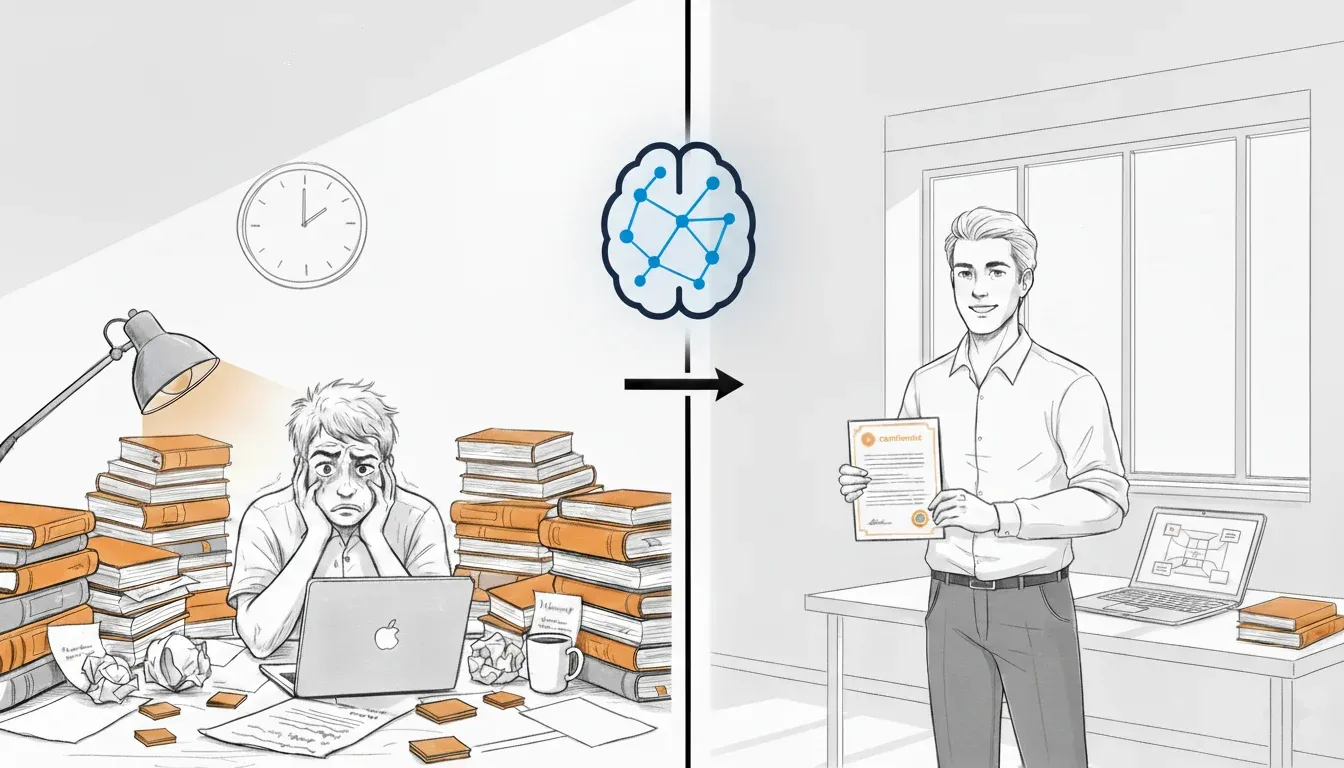
We know what it's like to stare at a 500-page study guide and wonder if you're even studying the right things.
That uncertainty — am I actually ready? — is the worst part. You can't cram your way past it, and most study tools don't solve it.

We built MindMesh Academy to replace that doubt with clarity.
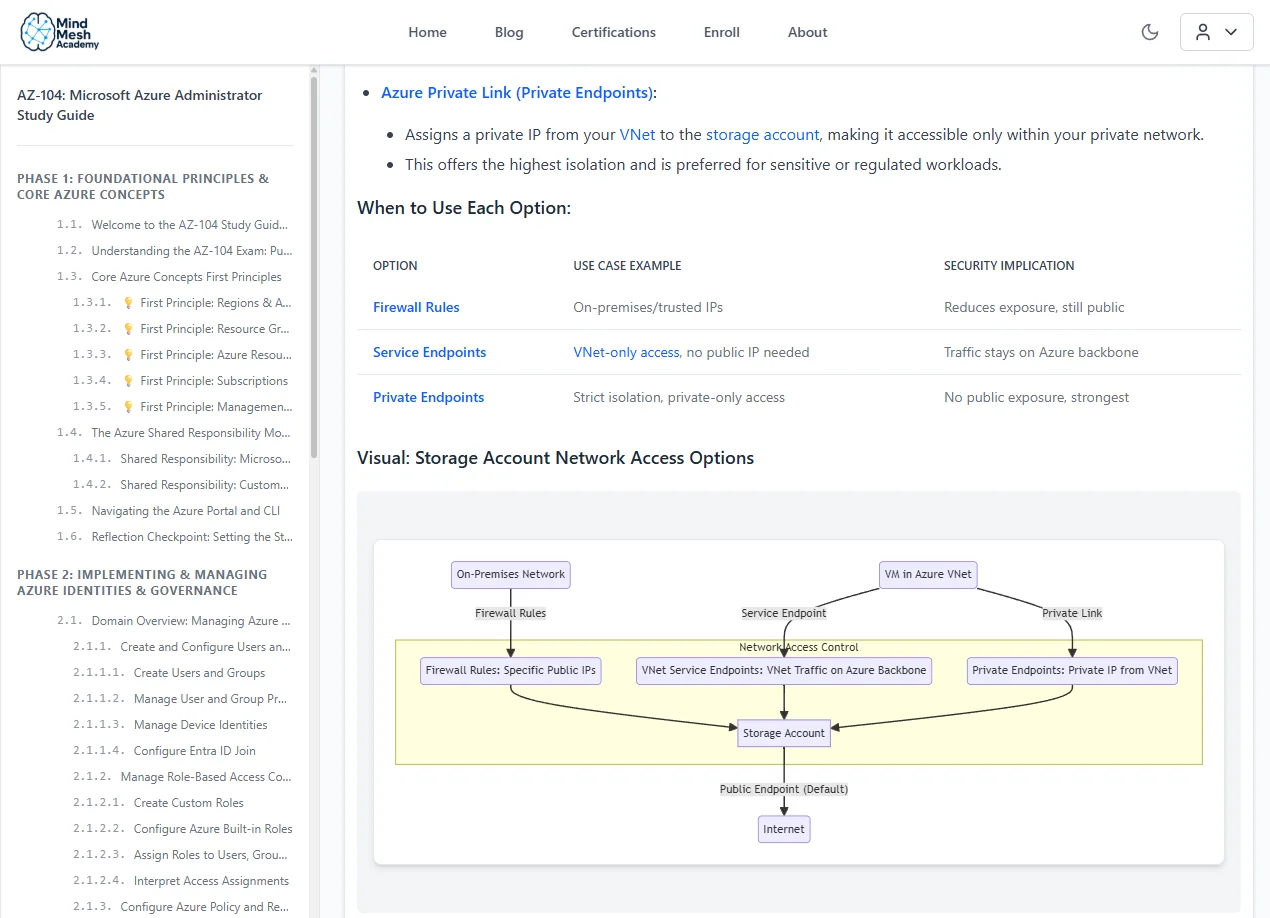
Our study guides distill the official syllabus into focused, structured content that builds real understanding — not just surface-level memorization.
Every section covers exam objectives efficiently so you spend your time learning what matters, not wading through filler.
Your Plan to Pass
Pick Your Exam
Choose from 30+ certification paths across AWS, Azure, CompTIA, and more.
Study Smarter
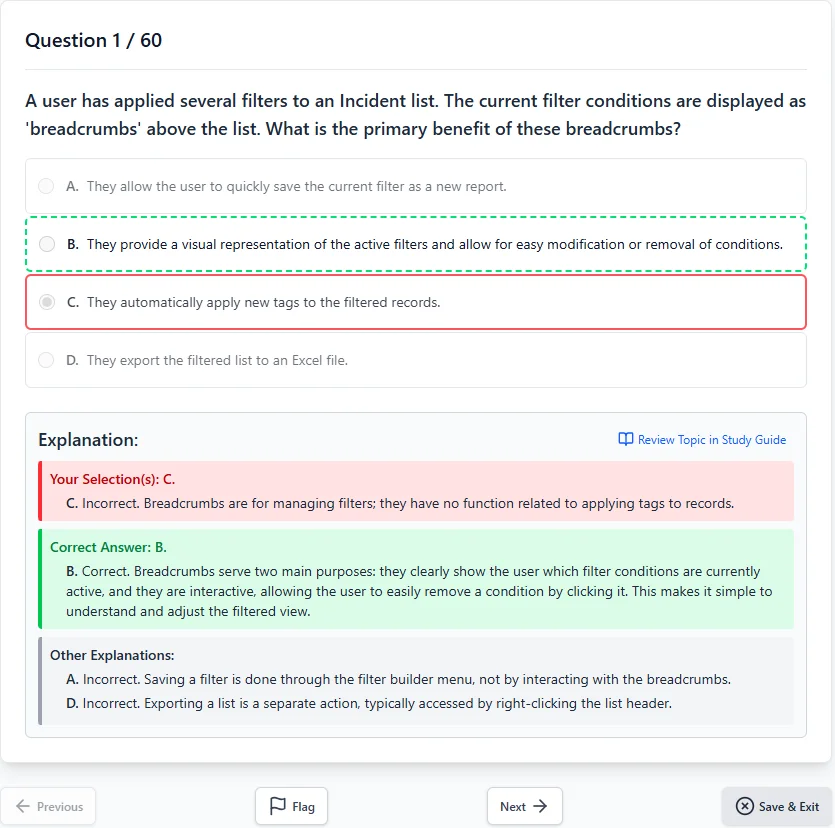
Work through study guides, practice questions, and flashcards that reinforce what you learn using spaced repetition.
Pass with Confidence
Walk into your exam knowing exactly where you stand — no surprises, no second-guessing.
See What You'll Be Working With
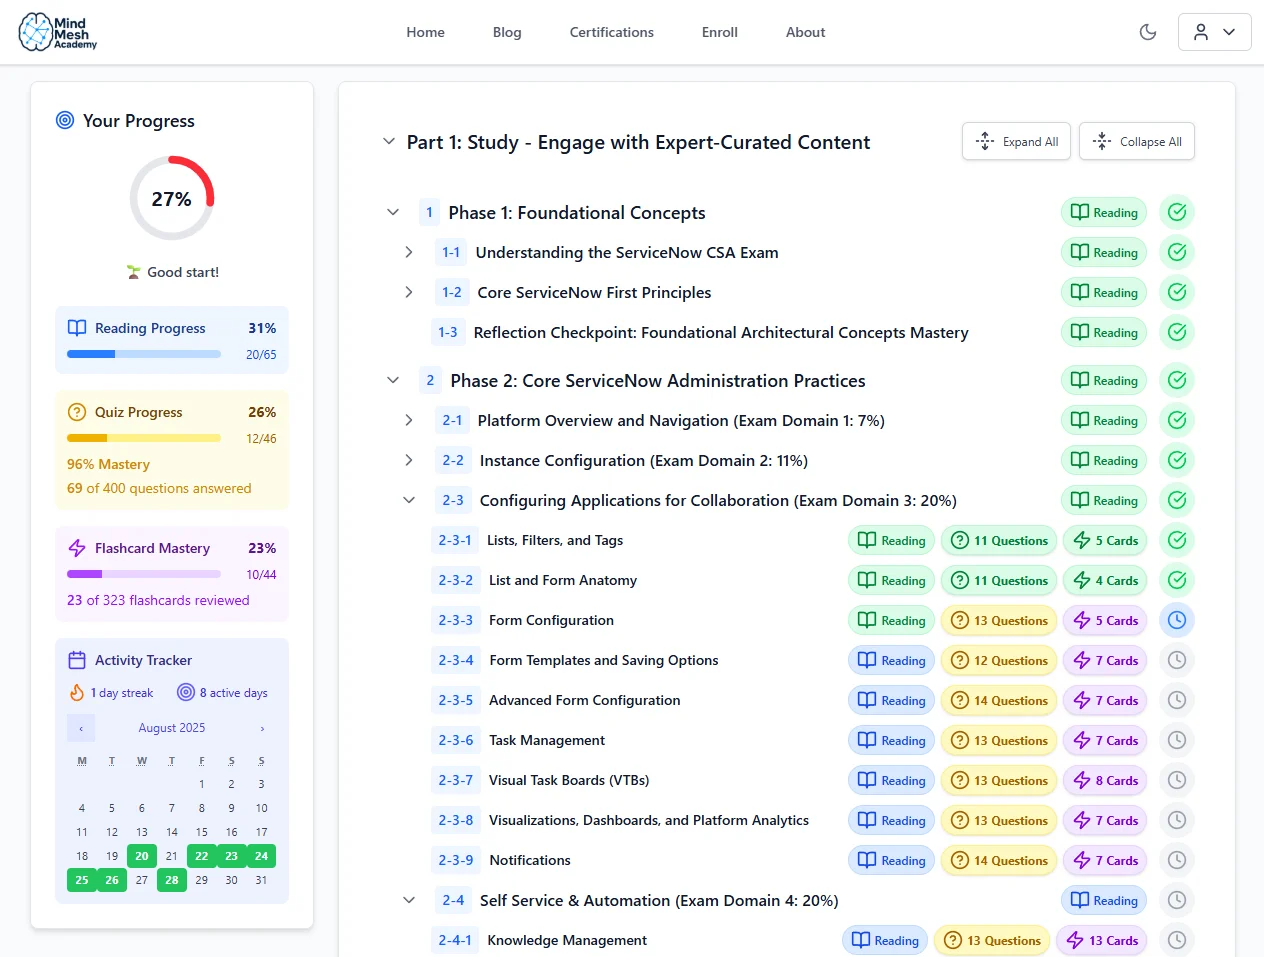
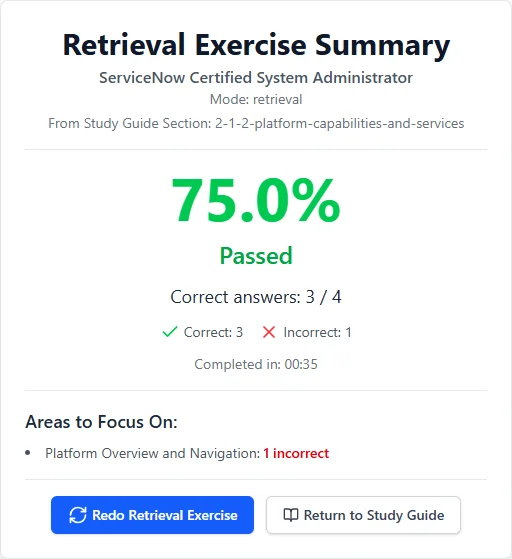
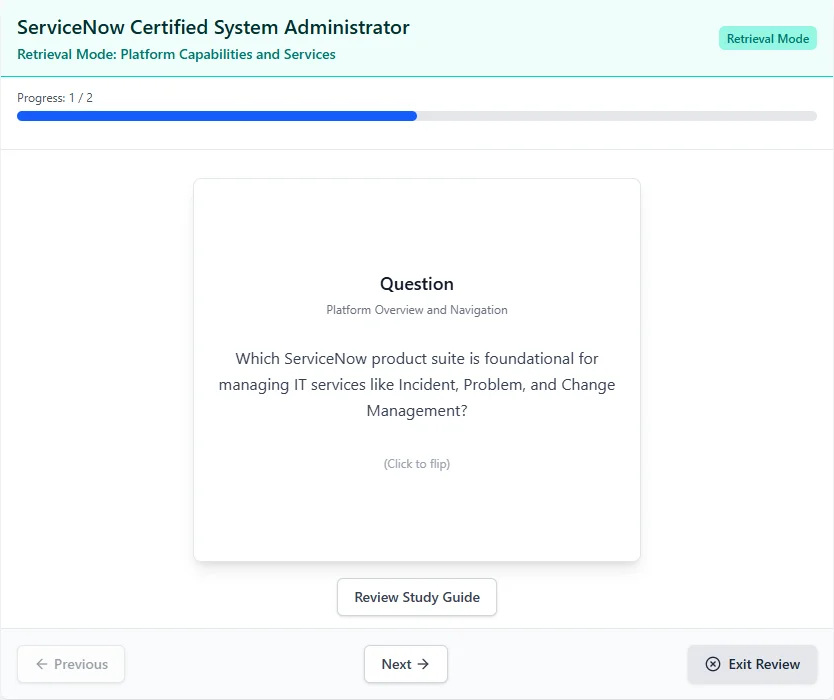
Track your progress through each topic so you always know where you stand.
Everything You Need to Pass — Nothing You Don't
Study the Right Things
Stop wondering if you're covering what's actually on the exam
Exam-Aligned Content
Materials built around real exam objectives so every hour of study counts.
Connected Study Tools
Guides, quizzes, and flashcards that work together — pick up where you left off.
Remember What You Learn
No more brain dumps that fade the morning after
Spaced Repetition
Proven memory techniques that move concepts from short-term cramming into lasting knowledge.
Adaptive Practice
Questions target your weak spots so you stop wasting time on what you already know.
Know When You're Ready
Replace 'am I ready?' with a clear answer
Mastery Tracking
See exactly which topics you've mastered and which need more work.
Weakness Analysis
Detailed breakdowns by topic show you precisely where to focus next.
Two Paths. One Choice.
Without a System
- Retake a $300+ exam you already studied for
- Spend another 3 months re-studying the same material
- Keep wondering "am I actually ready?" until exam day
- Explain to your team why the certification is delayed again
With MindMesh Academy
- Walk into exam day knowing you're ready
- Add the certification to your LinkedIn that week
- Apply what you learned on the job — not just on the test
- Move on to your next career goal instead of retaking
Imagine walking into your exam knowing you're ready — not hoping, not guessing, but knowing. That's what studying with a system feels like.
What Our Users Are Saying

Find Your Certification
Browse 30+ certification paths from AWS, Azure, CompTIA, Cisco, and more. Each one comes with a study guide, practice questions, and flashcards.
Your Next Certification Doesn't Have to Be a Grind
Pick your exam, start studying smarter, and walk into test day ready.